Describe the performance appraisal of alternative investments.
Alternative investments are typically exposed to greater risks than unleveraged long only traditional investments. These additional risks arise from the following: Timing of cash flows over an investment’s life cycle
Use of leverage by fund managers
Valuation of investments that may or may not have observable market prices Complexity of fees, taxes, and accounting
Ideally, returns on alternative investments should be adjusted for these risks, although that may be difficult in practice. It is clear, however, that evaluating alternative investment returns (or expected returns) without considering these additional risks would be naïvïe and possibly misleading.
Timing of Cash Flows
Alternative investments often have a life cycle that exhibits three phases:
1. In the capital commitment phase, a fund’s managers are identifying investments and making capital calls from the partners. Recall that limited partners commit a stated amount of capital that they will invest, but they do not necessarily deliver the entire amount immediately in cash. Managers make capital calls as they identify investments for which they require cash. Because of these cash outflows and the long-term nature of the typical investments, returns tend to be negative during the capital commitment phase.
2. During the capital deployment phase, the managers fund, and often involve themselves directly in, the firms or projects in which they invest. Returns typically remain negative in this phase, especially if the investments are in start-up companies or troubled firms that the managers are attempting to turn around.
3. If the fund’s investments succeed and begin to generate income and cash flows, the fund enters a capital distribution phase during which its returns turn positive and accelerate.
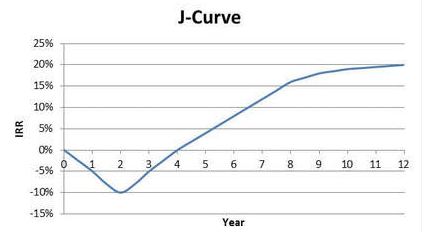
A J-curve effect (illustrated in Figure 77.1) reflects the norm of negative returns in the capital commitment phase, followed by increasing returns in the capital deployment phase and maximum returns in the capital distribution phase. Returns may reach a plateau toward the end of a fund’s life as the managers exit any remaining investments.
Figure 77.1: J-Curve Example
Given the variability of cash flows over a fund’s life and the importance of management decisions in the timing and magnitude of after-tax cash flows, an IRR over the life of a fund is the most appropriate measure of after-tax investment performance. (Recall from Quantitative Methods that a money-weighted rate of return, which is an IRR, is appropriate when a manager controls the timing of cash inflows and outflows.) A drawback to using IRRs is that they rest on assumptions about the cost of capital for cash outflows and the reinvestment rate for cash inflows.
A simpler measure of investment success is the multiple of invested capital (or money multiple)—the ratio of total capital returned plus the value of any remaining assets, to the total capital paid in over the life of the investment. Because this measure does not consider the timing of cash inflows and outflows, which can affect annual returns on invested capital significantly, it can be considered somewhat naïvï e.
Use of Leverage
Some alternative investments, particularly hedge funds, use borrowing to magnify their gains (at the risk of magnifying losses). Hedge funds may arrange margin financing with prime brokers or employ leverage by means of derivatives.
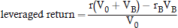
To state the effect of leverage on returns, consider a fund that can invest the amount V0 without leverage, and earn the rate of return r. The fund’s unleveraged portfolio return (as a money amount) is simply this: r × V0. Now, let’s say this fund can borrow the amount VB at an interest rate of rB, and earn r by investing the proceeds. The fund’s leveraged portfolio return (again, as a money amount), after subtracting the interest cost, then becomes:

Thus, stated as a rate of return on the initial portfolio value of V0, the leveraged rate of return is as follows:
One of the reasons that funds use leverage is that some strategies attempt to exploit relatively small pricing anomalies that might not produce meaningful results without leverage. A risk from using leverage is that a lender may issue margin calls if a fund’s equity position decreases below a certain level. These can result in a fund having to realize losses by closing positions or liquidating investments at unfavorable prices. If the fund must sell a large position in a security, doing so may depress its price further. Another important risk of funds that depends on leverage is that lenders may limit their access to additional borrowing.
Valuation of Investments
As we have discussed, many alternative investments involve illiquid assets that do not trade frequently in transparent markets. While funds must recognize investments at fair value to comply with accounting standards, fair value might rest on assumptions of which an investor in a fund should be aware. A fair value hierarchy groups these assumptions into the following three levels:
Level 1. The assets trade in active markets and have quoted prices readily available, such as exchange-traded securities.
Level 2. The assets do not have readily available quoted prices, but they can be valued based on directly or indirectly observable inputs, such as many derivatives that can be priced using models.
Level 3. The assets require unobservable inputs to establish a fair value, such as real estate or private equity investments, for which there have been few or no market transactions.
Particularly for Level 3 investments, the absence of market activity can result in valuations that remain near their initial cost for long periods. As a result, these values might not reflect the actual exit costs of the investments. Importantly, this relative lack of change in fair values can make reported returns for alternative investments appear higher, less risky, and less correlated with traditional investments than they really are.
Fee Structures
In the next LOS, we will examine some of the effects on investors’ returns of different fee specifications, such as high-water marks, hard or soft hurdle rates, and waterfall structures. Keep in mind that fee structures are subject to negotiation (e.g., a limited partner might agree to a higher management fee in exchange for fewer restrictions on redemptions) and may differ depending on how early in a fund’s life cycle an investor commits capital. Thus, different investors in the same fund might realize significantly different returns.
Calculate and interpret alternative investment returns both before and after fees.
We have seen how margin calls may require a leveraged fund to exit investments at unfavorable prices and unintended times. A similar risk arises from investor redemptions. The more negative a fund’s returns, the more likely investors are to ask the manager to redeem their positions. For this reason, and because of the J-curve effect of negative returns in the early years, alternative investment funds (particularly hedge funds) typically take measures to restrict early redemptions.
A lockup period is the time after initial investment over which limited partners either cannot request redemptions or incur significant fees for redemptions. A notice period (typically between 30 and 90 days) is the amount of time a fund has to fulfill a redemption request. Notice periods allow time for managers to reduce positions in an orderly manner. Fund managers often incur significant transactions costs when they redeem shares. Redemption fees can offset these costs. Managers may also have the discretion to implement a gate that restricts redemptions for a temporary period.
Investors should be aware that other investors may receive terms that differ from those stated in the partnership agreement. Customized fee structures are contained in side letters with individual investors detailing how their terms differ from those in the standard offering documents.
Although “2 and 20” and “1 and 10” were, at one time, fairly standard fee structures for fund and fund-of-funds investments, these fee structures continue to be under competitive pressure. Investors making larger commitments can negotiate lower fees. There can also be a tradeoff between liquidity provisions and fees. Investors can negotiate for lower fees or better liquidity (shorter lockups and notice periods). Hurdle rates, hard versus soft hurdles, and catch-up provisions may also be subject to negotiation.
Early investors in a fund may also receive lower fees or better liquidity terms as an incentive to invest at the fund’s inception. The investment interests of early investors who receive such relatively better terms are called founders class shares.
Annual investor fees can also be either-or fees, the maximum of the management fee or the incentive fee. Under such a structure, with a 1% management fee and a 30% incentive fee, investor fees each year would simply be the management fee unless the calculated incentive fee is higher. Such a structure may also stipulate that the 1% management fee be subtracted from the incentive fee in a subsequent year.
Biases in Alternative Investment Returns
Numerous alternative investment indexes exist to measure historical performance. However, they may not provide much meaningful information on the asset class because each fund’s structure is unique, and the funds that exist at any given time can be in widely different phases of their life cycles. One way around this latter issue is to compare funds that originated in the same vintage year.
The effect of survivorship bias is greater for a hedge fund database than for other asset classes because by some estimates, more than 25% of hedge funds fail in the first three years of their existence. An index that does not include failed funds will overstate the returns and understate the risk of hedge funds as an asset class. These effects may be magnified by backfill bias, which occurs when managers only select their successful funds for inclusion in indexes.
Return Calculations for Alternative Investments
Before-fee returns on alternative investments are calculated the same way we calculate returns on any investment. The calculation of holding period returns and periodic rates of return, both with and without interim cash distributions, is described in Quantitative Methods and expanded on by application in other topic areas.
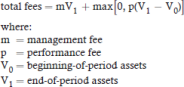
Calculating after-fee returns simply requires adjustment of the cash flows or values for the various fees involved, typically management and performance fees. For a simple case in which management fees are a fixed percentage of end-of-period assets and performance fees are a fixed percentage of total return with no hurdle rate, we can state the general partner’s total fees in money terms as follows:
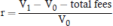
This is the rate of return for an investor after fees:
Fee structure provisions, such as hurdle rates and high-water marks, make calculating total fees more complex than this simple formula. Other provisions may state whether the performance fee is net of the management fee or independent of it, or whether the management fee is based on beginning-of-period assets or end-of-period assets.
EXAMPLE: Hedge fund fees
APK Funds is a hedge fund with a value of $150 million at initiation. BJI Funds charges a 2% management fee based on assets under management at the beginning of the year and a 20% performance fee with a 10% soft hurdle rate, and uses a high-water
mark. Performance fees are calculated on gains net of management fees. The year end values before fees are as follows:
Year 1: $140 million
Calculate the total fees for investor at the end of first year
Answer:
Year 1:
Management fee:
150.0 million × 2% = $3.0 million
There is no performance fee because the return after the management fee is less than the 10% hurdle rate.
Total fees:
$3.0 million
EXAMPLE: Fund-of-funds
An investor makes a total investment of $80 million in a fund-of-funds that has a “1 and 10” fee structure, with management and performance fees calculated independently based on year-end values. Of the $80 million investment, $40 million is allocated to the Delta fund and $40 million is allocated to the Vega fund. One year later, the value of the Alpha fund investment is $45 million, and the value of the Beta fund investment is $50 million, both net of fund fees. Calculate the investor’s return for the year net of fees.
Answer:
At year-end, the gross value of the investor’s investment is $45 + $30 = $95 million.
The fund-of-funds management fee is 1% of $95 million, which is $0.95 million. The investor’s gain for the year before fund-of-funds fees is $95 – $80 = $15 million.
The fund-of-funds manager’s performance fee is 10% of $15 million, which is $1.5 million.
The year-end value of the investor’s fund-of-funds investment is $95 – $0.95 – $1.5 = $92.55 million.
EXAMPLE: Waterfall structure and clawback provision
A private equity fund invests $200 million in a venture company that is sold for $260 million. The fund also invests $200 million in an LBO that goes poorly and is liquidated for $160 million.
1. If the carried interest performance fee for the GP is 20% and there is no clawback provision, calculate the investor’s return after performance fees, assuming the investment outcomes are realized in the same year under the following:
a. An American-style (deal-by-deal) waterfall structure
b. A European-style (whole-of-fund) waterfall structure
Answer:
1. Under an American-style (deal-by-deal) waterfall structure, a performance fee of 20% × ($260 – $200) = $12 million would be paid on the venture investment. Because there is a loss on the LBO investment, no performance fee is paid.
Under a European-style (whole-of-fund) waterfall structure, the gain for the period is 260 + 160 – 400 = $20 million, and the performance fee is 20% × 20 = $4 million.